Below are relevant values we collected from the tournament.
Disclaimers: It’s just raw data, with a lot of bias imo, I don’t know how useful they are to say certain things. It is up to the users to define how to interpret or discard them.
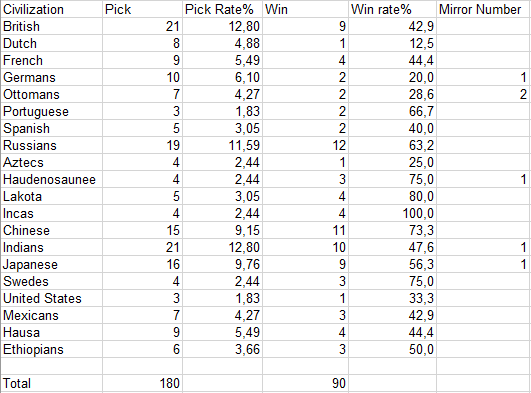
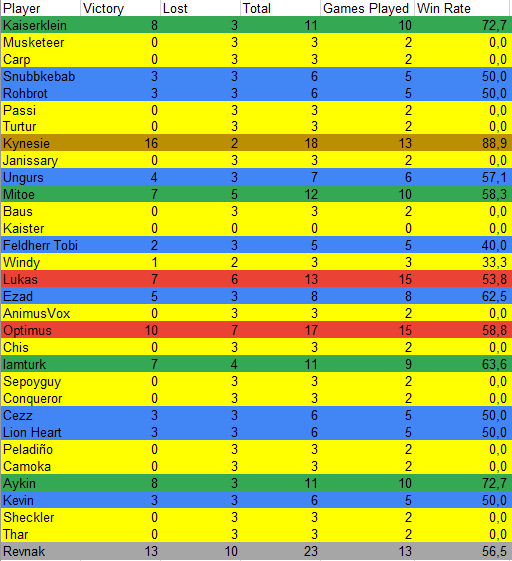
On the other hand, following the advice from the previous time, the data of each game and mach up are attached, and two summary tables of the win rates of the civilizations and the individual performance of each player.
Has to be taken into context though, inca for example 100% win rate but only 4 games played and I’d assume all of those 4 were by kynesie the tournament winner.
It’s interesting with the most picked civs though where you get a better idea about their balance. Russia and china appear to be strong currently.
They’ve been a bit weak since forever, just too slow to get started.
I’d say portugal is probably the weakest civ currently, on here it’s got a 66% win rate though, but worth mentioning that it was only probably picked on water maps and probably only by the guy that won the tournament lol.
Interesting to see lakota on 80% too, but I guess things like counter picks and stuff will be effecting certain civs win rate.
Of course, I believe that this data can only be used in conjunction with the data from the previous tournament. Moreover, I think that only with the data of the next tournament, one would have enough data to get probabilities and test hypotheses without much chance of being wrong. For example, if in the next tournament Russia has a high pick and a high win rate again, we can safely say that Russia is too strong. But as I made clear above, I don’t know how useful this data can be, and it’s up to the user how he wants to use it.
Sample size is too small but some conclusions can still be drawn:
(1) civs with >10 picks can be somewhat compared, but one needs to keep in mind highly picked civs usually have a strong basis in the first place (except when the win rate is ridiculously low, which has not happened)
(2) low picked civs are either comparatively weak or too weird to play with