I was curious to see how the average Elo of players was changing over time (as well as more generally the number of unique players and number of games being played). It resulted in the following graphs. I don’t really have a point here but I found it interesting so thought I’d share encase anyone else did.
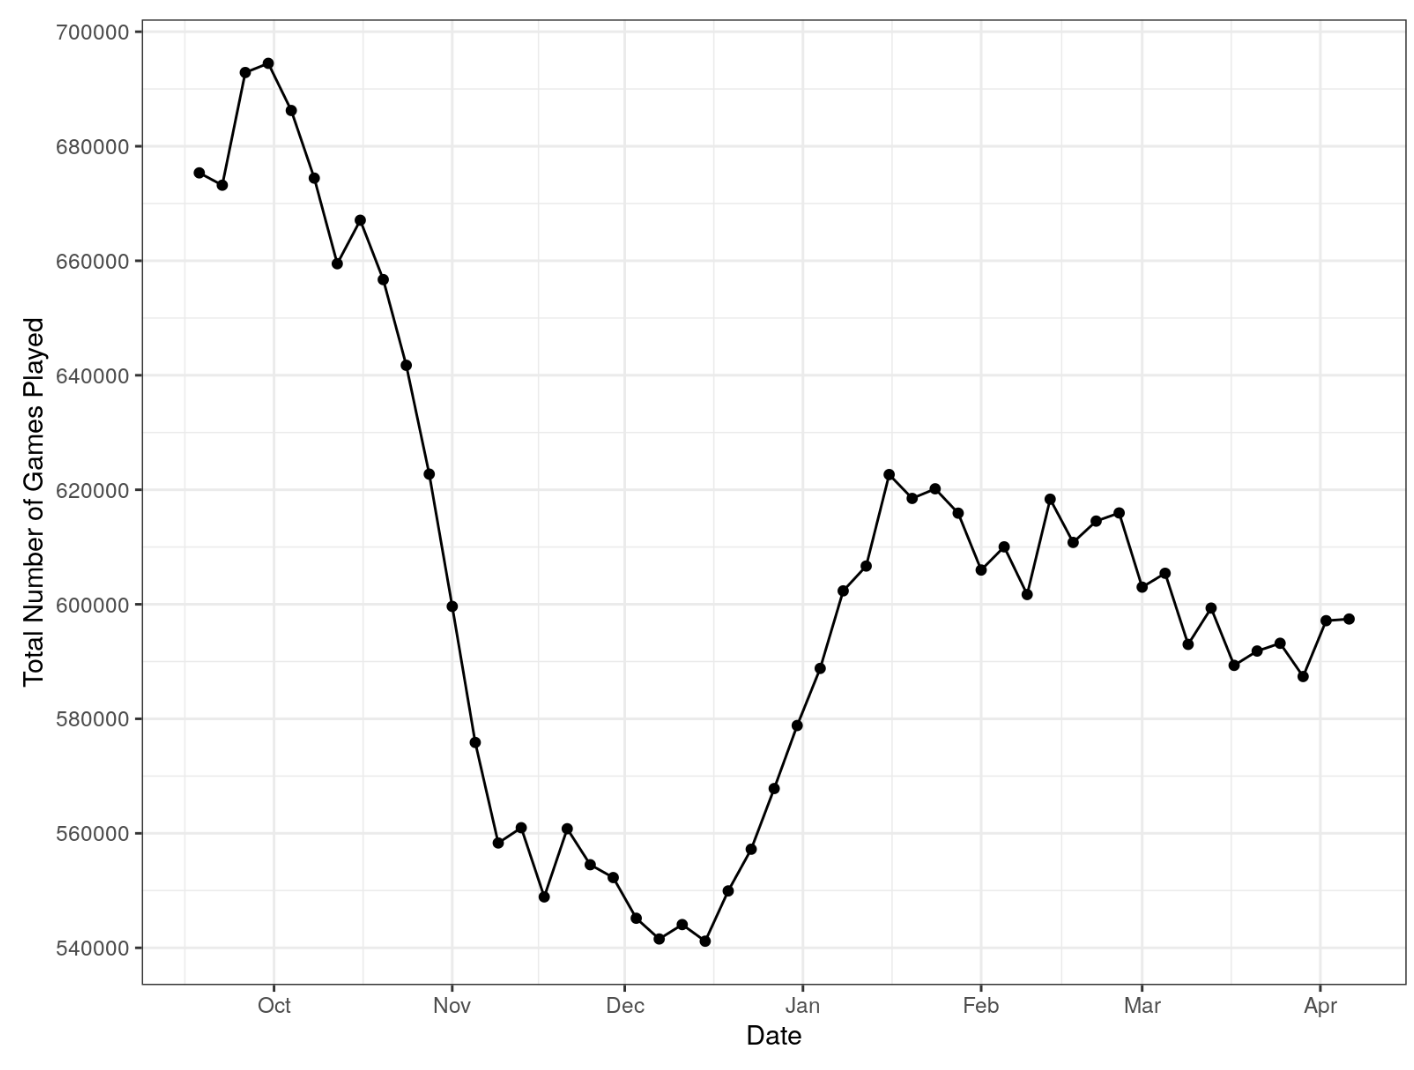
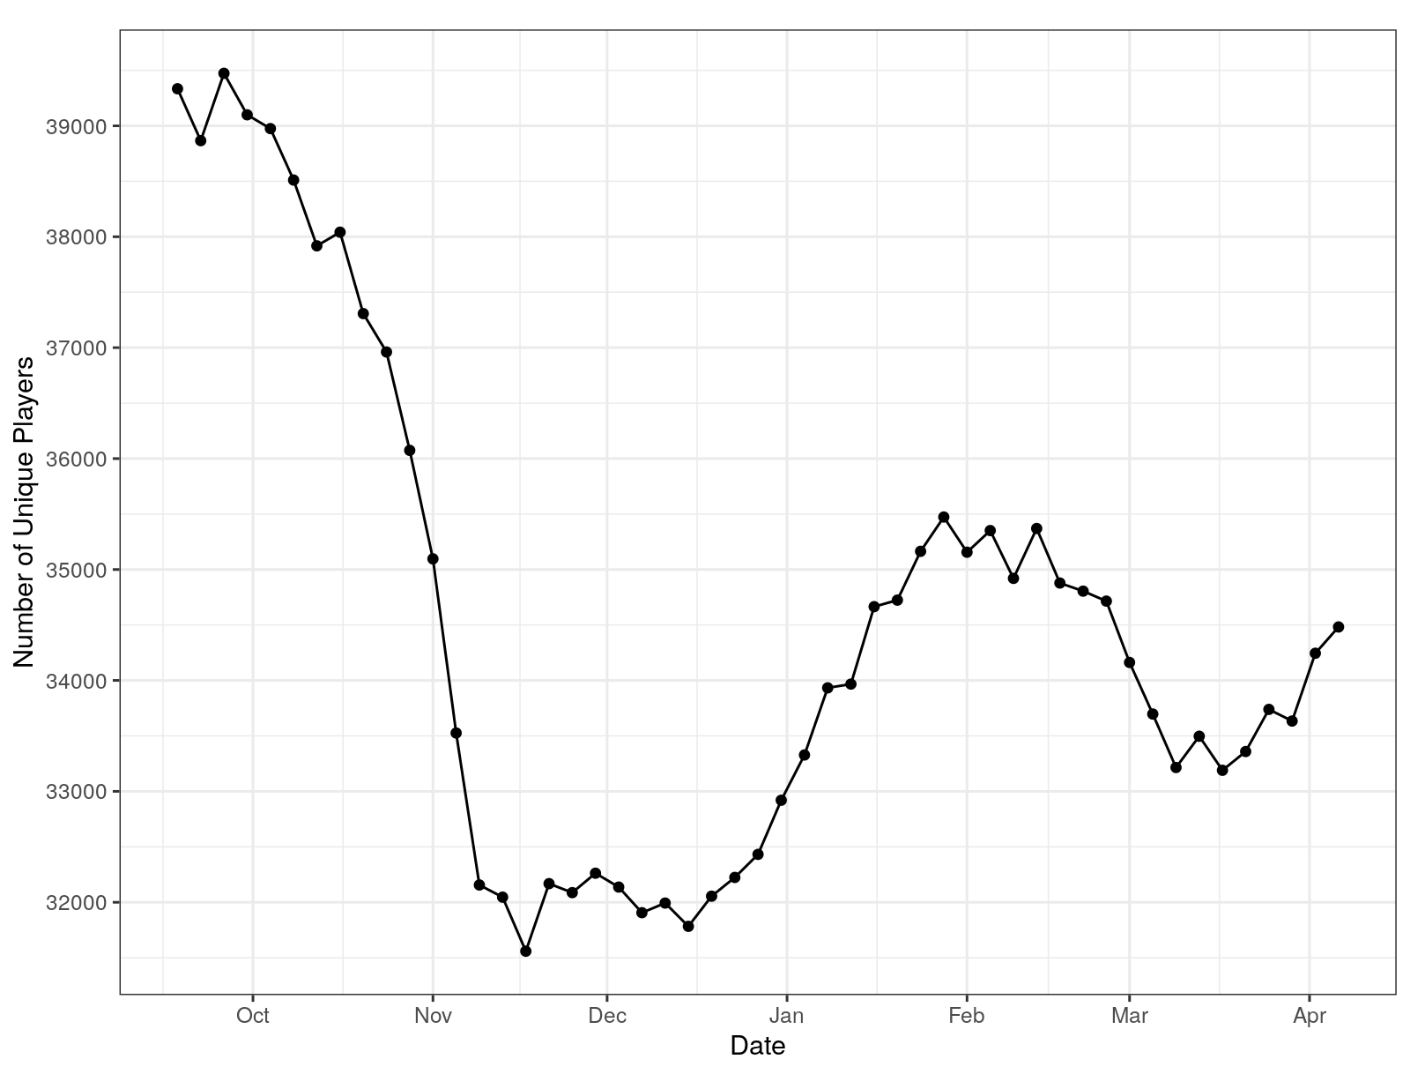
For reference graphs are calculated by creating a sliding +/- 10 day window around each day for the 1v1 RM ladder calculating (1) the total number of games played in this window, (2) The average of each players average elo rating for all matches that fall within the window, (3) the number of unique players that played within the window.
Average Player Elo Over Time

Total Number of Games Played Over Time
Number of Unique Players Over Time
EDIT: Added clarifications on how graphs were derived.