You guys probably heard of the civ grid by now in one way or another. It is a project made by some members of the Sunbros Discord that is updated by patch basis. The grid itself is also updated every 3-4 days with recent game data and this is the latest one for the last patch:
Sunbros Civ Grid, April '23 Update
You might not know that the excel sheet doesn’t end with only the civ grid. There is way more data to it. This thread will try to summerize briefly about the other content you can check inside. In the buttom of the sheet you can see that there are several others pages as well, including 'Win/Loss Rates, By Minute’, ‘Score Tracker’, ‘Data display ideas’ , ‘Work in Progress’ and ‘Time of Game Grid’.
![]()
Lets look into the others stuff:
Score Tracker
Its exactly as the name suggets; it tracks the score of the civ per data insert. It saves the ‘past’ score of the civ and allows you to view if overall after some time, the score of the civ has grown, stalled or decreased. Its purpose is to find out if some new strategy was find out for a certain civ.
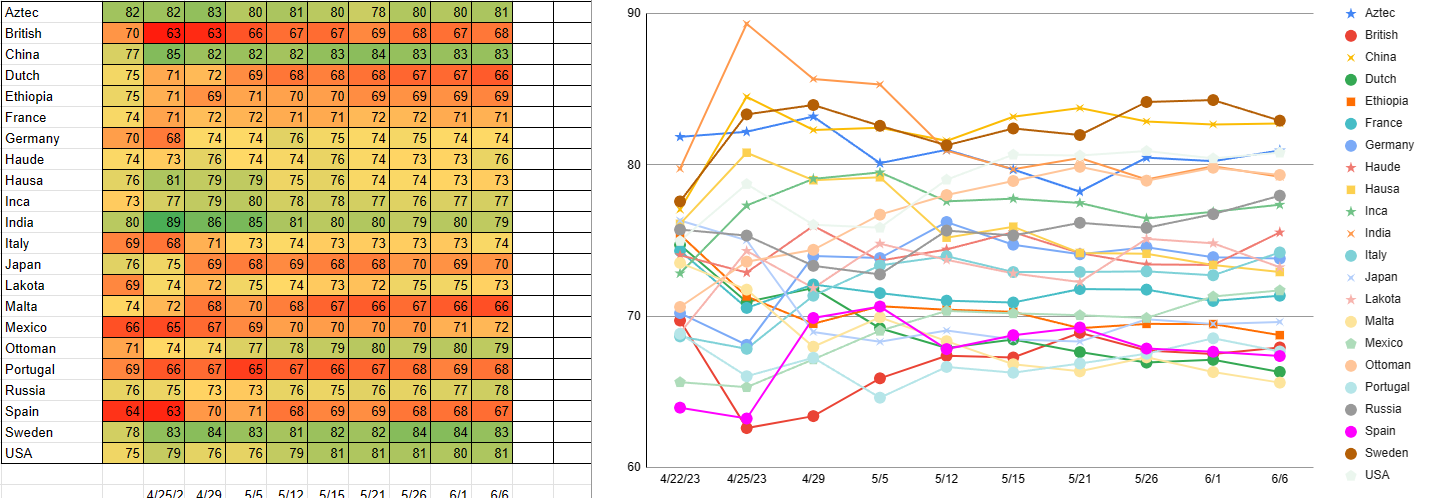
Numbers of games Tracker
This is just to give an idea of how many games there is data of for Each civ, so you can take how ‘accurate’ the data is. As lower number of games means that the data has less accuracy representing all the graphs.
Win/Loss per minute
This tells you overall of the games the civ played, the percentage of their winning/losing within a time frame.
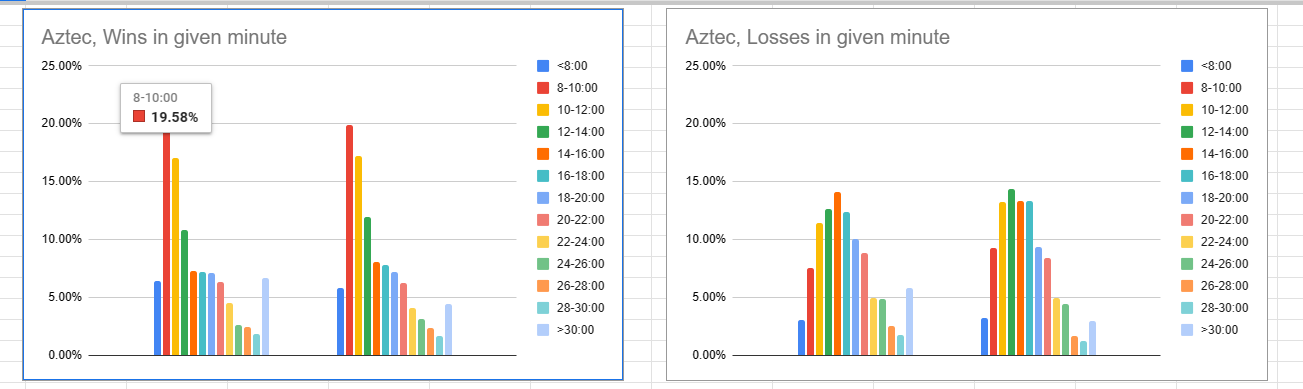
Looking the cursor, we can see it says ‘8-10:00, 19.58%’. This means that of all the matches Aztecs won, 20% of those were between 8 and 10 minute mark. It allows you to see the strength of the civ. You can reasonably say that Aztec is mainly used for rush and that it is overall good at it. It is seperated by elo bracket, so first graph is about 1.1k+ elo, second about 1-3k+ elo.
Data
We can ignore this, its just raw numbers.
Data Displays Ideas
This is the most interesting page overall. It takes all the games apart and tells you for each civ, what is their pick rate overall, how many games are played in each elo bracket, in which type of maps a civ has increased or decreased win rates. For example:
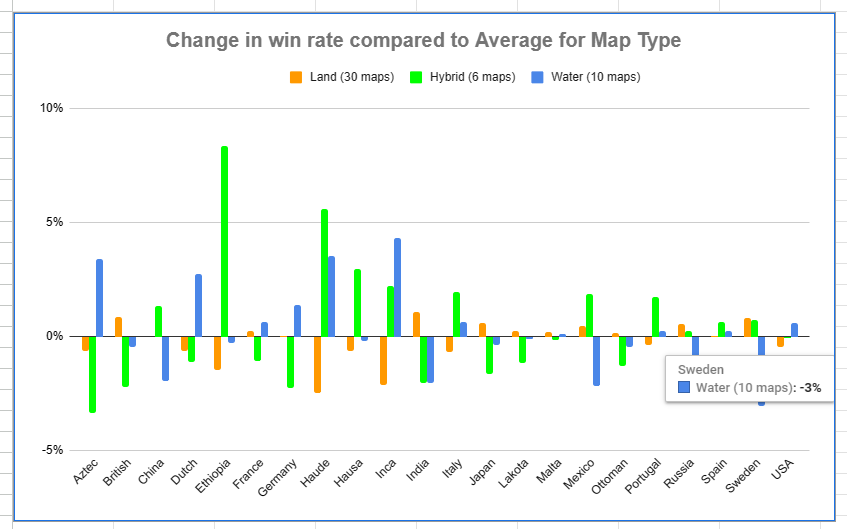
In this graph above we can see that Sweden has a decrease of 3% in its win rate in water maps.
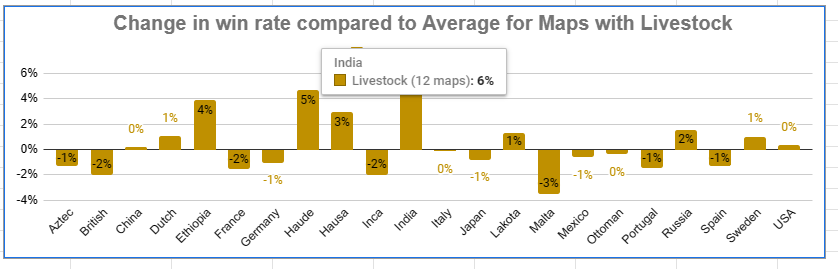
That India has a 6% increase in maps with livestocks
or for map with high amount of woods:
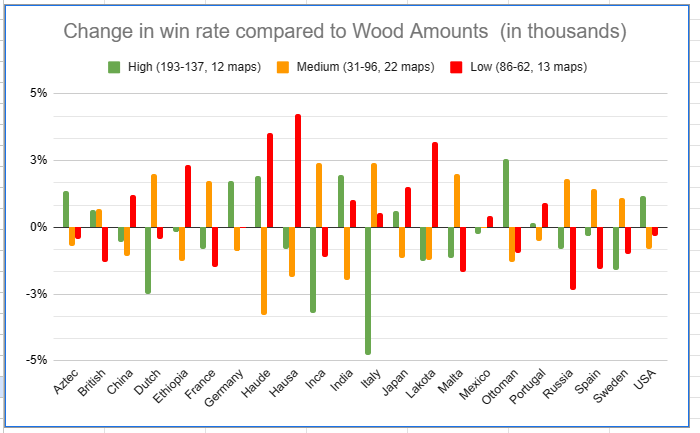
And to end there is even a map specific win rate:
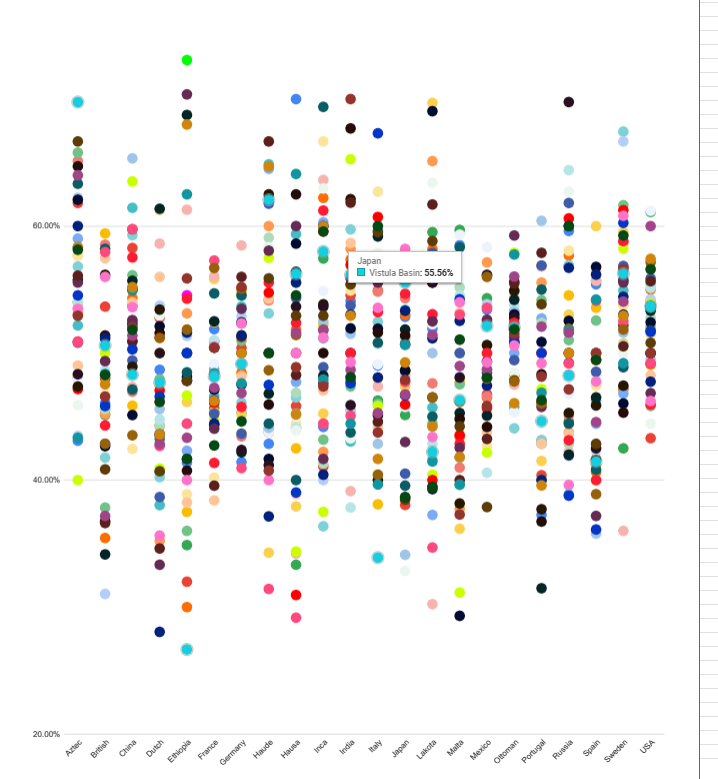
Japan on Vistula Basin has 55% win rate.
Others
They can be ignored for now, they don’t say much.